
Information dashboard of the city of Bratislava presents interesting information about the Slovak capital in a simple, easy-to-read and attractive form. Selected statistical indicators approximate life in the capital through interactive graphs and map their development over time.
Every year, the Statistical Office of the Slovak Republic publishes a comprehensive publication about the capital of the Slovak Republic, which on 260 pages provides information on economic, social and demographic development, as well as unique information, e.g. about education, healthcare and business. The current edition of the Statistical Yearbook of the Capital of the Slovak Republic Bratislava 2025, is available in the Catalog of Publications.
Detail of the publication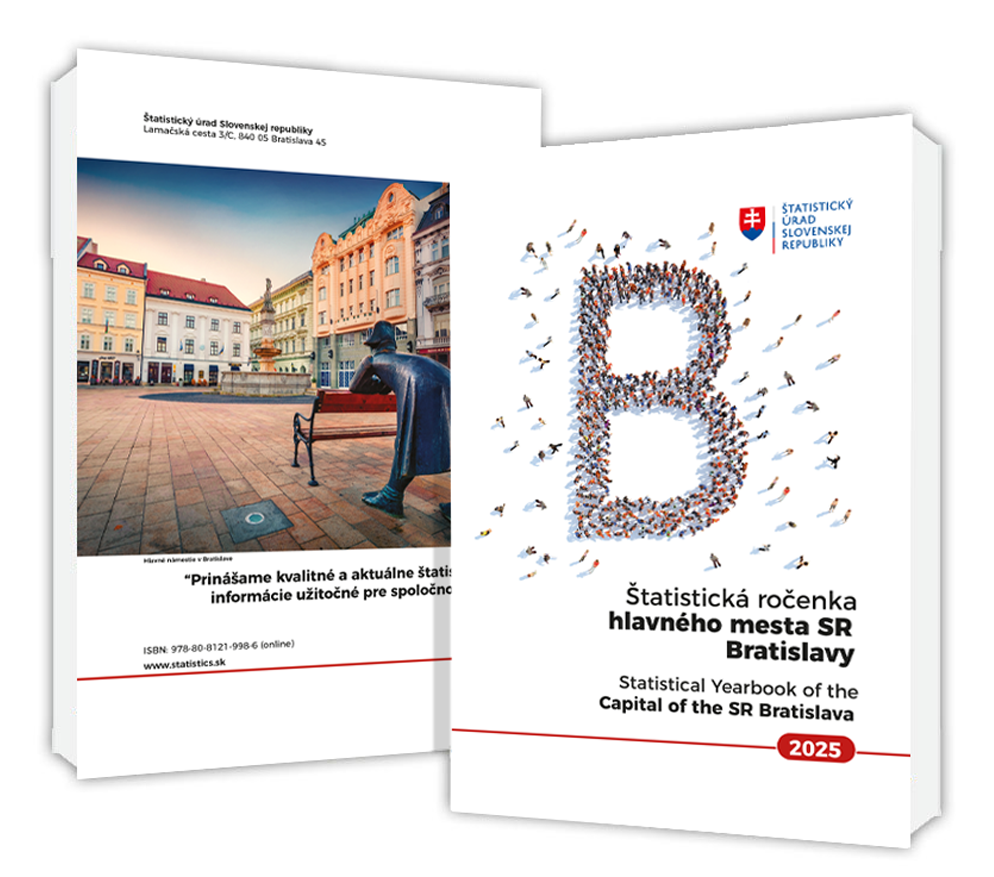
Statistical yearbook of Bratislava 2022
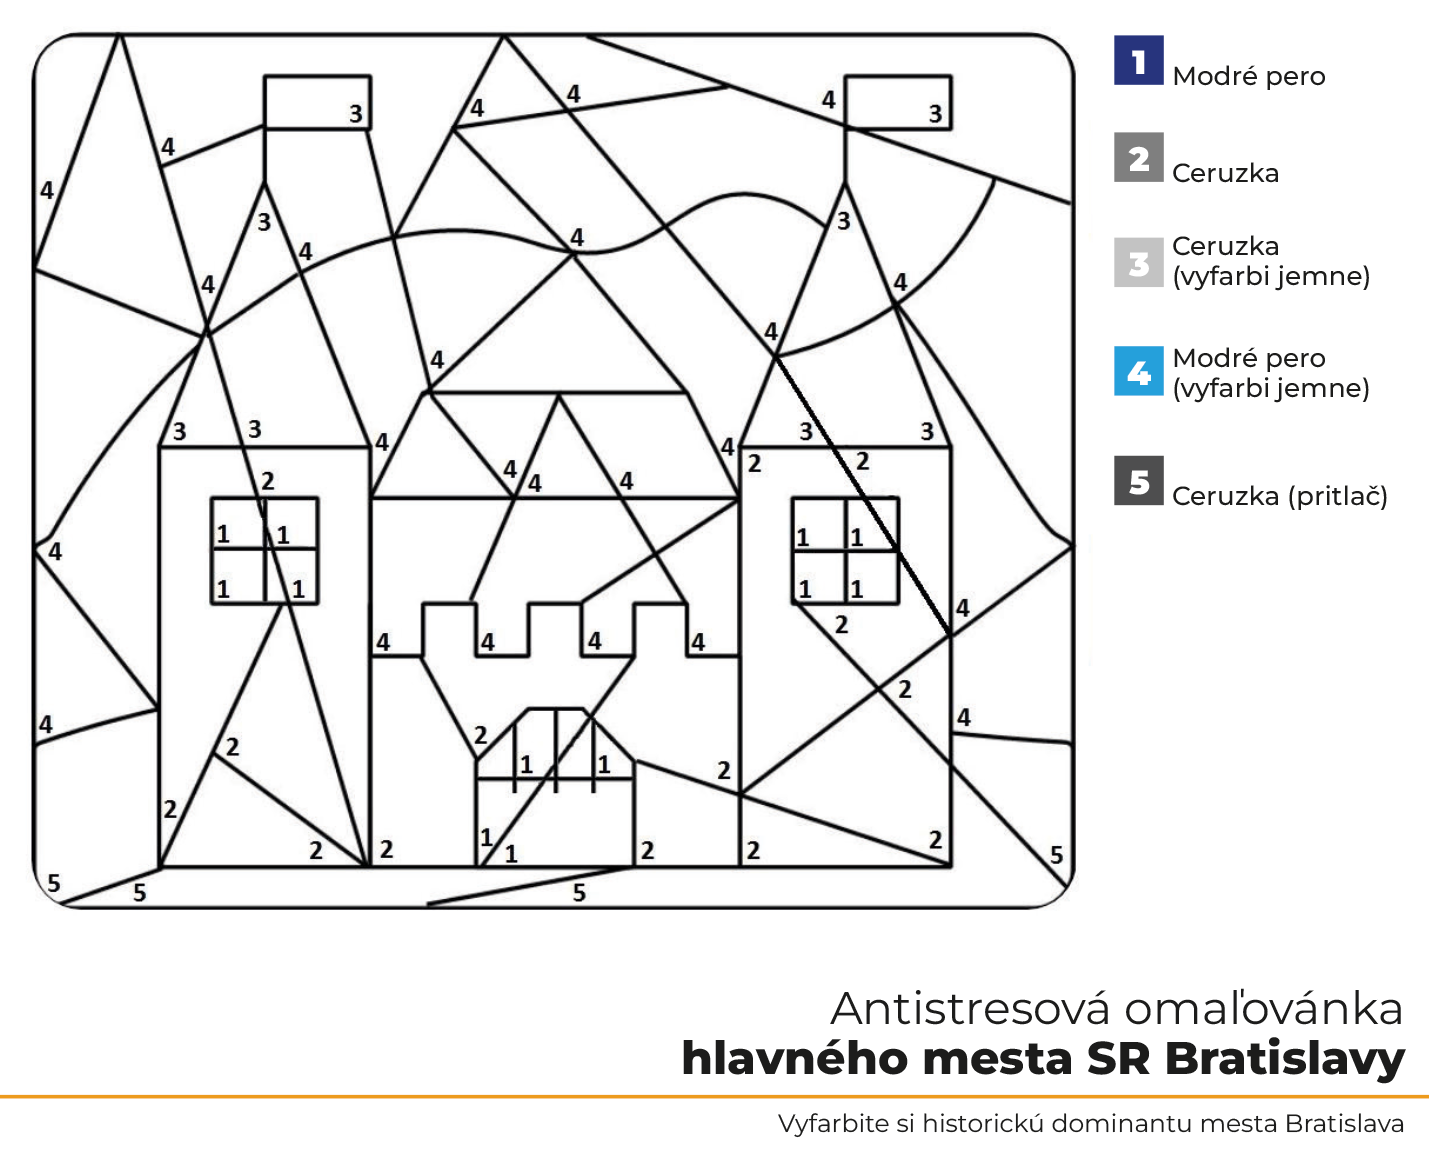
Antistress coloring book
Color the historical landmark of the city of Bratislava.
Statistical yearbook of Bratislava 2021
Pexeso
Compare historical and current Bratislava
Play a memory game. Discover and compare the differences between historical and contemporary Bratislava. We believe that you will learn something new and see your city in a wider context.
Information dashboard of the city of Bratislava
Live-births, deaths and natural increase (persons)
Number of live-born children in the surveyed period. A live-born child is a child showing at least one of the following signs of life at birth (breathing, beating of the heart, pulsation of the umbilical cord or active movement of muscles), with the birth weight 500 and more grams or 499 grams and less if a child survives 24 hours after its birth.
Number of deaths in the surveyed period. Death is the irreversible termination of bioelectrical processes in the body's central nervous system.
| Month | Live births | Deaths | Natural increase |
|---|---|---|---|
| 1993 | 4484 | 3871 | 613 |
| 1994 | 3940 | 3729 | 211 |
| 1995 | 3829 | 3992 | -163 |
| 1996 | 3416 | 3958 | -542 |
| 1997 | 3468 | 3968 | -500 |
| 1998 | 3275 | 3972 | -697 |
| 1999 | 3240 | 3985 | -745 |
| 2000 | 3400 | 4089 | -689 |
| 2001 | 3139 | 3863 | -724 |
| 2002 | 3201 | 3856 | -655 |
| 2003 | 3454 | 3964 | -510 |
| 2004 | 3672 | 3974 | -302 |
| 2005 | 4012 | 4116 | -104 |
| 2006 | 4141 | 4159 | -18 |
| 2007 | 4317 | 4062 | 255 |
| 2008 | 4688 | 4110 | 578 |
| 2009 | 5052 | 3995 | 1057 |
| 2010 | 5163 | 4178 | 985 |
| 2011 | 5356 | 4010 | 1346 |
| 2012 | 5088 | 4050 | 1038 |
| 2013 | 4996 | 4151 | 845 |
| 2014 | 5236 | 3968 | 1268 |
| 2015 | 5328 | 4185 | 1143 |
| 2016 | 5475 | 4175 | 1300 |
| 2017 | 5581 | 4332 | 1249 |
| 2018 | 5684 | 4401 | 1283 |
| 2019 | 5403 | 4220 | 1183 |
| 2020 | 5411 | 4465 | 946 |
| 2021 | 5265 | 5642 | -377 |
| 2022 | 4692 | 4787 | -95 |
| 2023 | 4170 | 4389 | -219 |
| 2024 | 3952 | 4405 | -453 |
| 2025 | 3433 | 4207 | -774 |
Immigrants and emigrants (persons)
Immigrants on permanent residence is the number of persons who immigrated to the certain territorial unit, either from other territorial units within the Slovak Republic or from abroad.
Emigrants from permanent residence is the number of persons who emigrated from the certain territorial unit, either to other territorial units within the Slovak Republic or abroad.
Net migration is the difference between the number of immigrants and the number of emigrants.
| Month | Imigrants | Emigrants | Net migration |
|---|---|---|---|
| 1995 | 4552 | 3112 | 1440 |
| 1996 | 4152 | 3375 | 777 |
| 1997 | 3693 | 4086 | -393 |
| 1998 | 3639 | 4790 | -1151 |
| 1999 | 3462 | 3972 | -510 |
| 2000 | 3657 | 3915 | -258 |
| 2001 | 3950 | 4028 | -78 |
| 2002 | 4698 | 5088 | -390 |
| 2003 | 4035 | 5041 | -1006 |
| 2004 | 4708 | 4784 | -76 |
| 2005 | 5350 | 4942 | 408 |
| 2006 | 5825 | 5175 | 650 |
| 2007 | 6248 | 5667 | 581 |
| 2008 | 6823 | 5537 | 1286 |
| 2009 | 6100 | 4887 | 1213 |
| 2010 | 6297 | 5542 | 755 |
| 2011 | 6356 | 5002 | 1354 |
| 2012 | 6116 | 4757 | 1359 |
| 2013 | 6045 | 5090 | 955 |
| 2014 | 6776 | 5755 | 1021 |
| 2015 | 8219 | 6108 | 2111 |
| 2016 | 8090 | 6399 | 1691 |
| 2017 | 8460 | 6068 | 2392 |
| 2018 | 8086 | 6069 | 2017 |
| 2019 | 10077 | 6398 | 3679 |
| 2020 | 7784 | 5508 | 2276 |
| 2021 | 7087 | 6636 | 451 |
| 2022 | 8539 | 7099 | 1440 |
| 2023 | 7682 | 6345 | 1337 |
| 2024 | 7703 | 5901 | 1802 |
| 2025 | 8499 | 6212 | 2287 |
Total increase of population (persons)
Total increase of population is the difference between the population at the beginning of the period and at the end of the period. It is the sum of natural increase and net migration. Negative result of total increase means total decrease of population.
| Month | Total increase of population |
|---|---|
| 1993 | 2130 |
| 1994 | 1991 |
| 1995 | 1277 |
| 1996 | 235 |
| 1997 | -893 |
| 1998 | -1848 |
| 1999 | -1255 |
| 2000 | -947 |
| 2001 | -802 |
| 2002 | -1045 |
| 2003 | -1516 |
| 2004 | -378 |
| 2005 | 304 |
| 2006 | 632 |
| 2007 | 836 |
| 2008 | 1864 |
| 2009 | 2270 |
| 2010 | 1740 |
| 2011 | 2700 |
| 2012 | 2397 |
| 2013 | 1800 |
| 2014 | 2289 |
| 2015 | 3254 |
| 2016 | 2991 |
| 2017 | 3641 |
| 2018 | 3300 |
| 2019 | 4862 |
| 2020 | 3222 |
| 2021 | 74 |
| 2022 | 1345 |
| 2023 | 1118 |
| 2024 | 1349 |
| 2025 | 1513 |
Marriages and divorces
Number of all marriages in the surveyed period processed by permanent residence of a groom. Marriage is a legal act of entering into marriage. It is a union of a man and a woman, which arises by virtue of their voluntary and free decision to contract marriage.
Number of all divorced marriages in the surveyed period processed by last permanent residence of a spouse. Divorce is a legal form for termination of marriage of living spouses.
| Month | Nuptiality | Divorce |
|---|---|---|
| 1993 | 2320 | 1140 |
| 1994 | 2165 | 1158 |
| 1995 | 1968 | 1147 |
| 1996 | 2058 | 1243 |
| 1997 | 2163 | 1166 |
| 1998 | 2111 | 1309 |
| 1999 | 2285 | 1182 |
| 2000 | 2196 | 1134 |
| 2001 | 2027 | 1130 |
| 2002 | 2185 | 1178 |
| 2003 | 2375 | 1234 |
| 2004 | 2470 | 1208 |
| 2005 | 2406 | 1294 |
| 2006 | 2485 | 1415 |
| 2007 | 2569 | 1218 |
| 2008 | 2547 | 1347 |
| 2009 | 2483 | 1178 |
| 2010 | 2459 | 1203 |
| 2011 | 2471 | 1025 |
| 2012 | 2577 | 1050 |
| 2013 | 2481 | 1050 |
| 2014 | 2693 | 940 |
| 2015 | 2887 | 1008 |
| 2016 | 2946 | 829 |
| 2017 | 3056 | 942 |
| 2018 | 3078 | 922 |
| 2019 | 2779 | 909 |
| 2020 | 2377 | 701 |
| 2021 | 2388 | 654 |
| 2022 | 2909 | 727 |
| 2023 | 2464 | 847 |
| 2024 | 2334 | 923 |
| 2025 | 2226 | 818 |
Average maternal age at the first childbirth (years)
Average maternal age at childbirth is mean age of mothers usually in the given year. It is calculated from fertility rate by age. Average age of primiparas is specifically monitored.
| Month | Average maternal age at the first childbirth |
|---|---|
| 1993 | 26,63 |
| 1994 | 26,81 |
| 1995 | 26,94 |
| 1996 | 27,21 |
| 1997 | 27,26 |
| 1998 | 27,47 |
| 1999 | 27,63 |
| 2000 | 28,21 |
| 2001 | 28,13 |
| 2002 | 28,65 |
| 2003 | 28,98 |
| 2004 | 29,23 |
| 2005 | 29,61 |
| 2006 | 29,89 |
| 2007 | 30,23 |
| 2008 | 30,52 |
| 2009 | 30,90 |
| 2010 | 31,26 |
| 2011 | 31,46 |
| 2012 | 31,63 |
| 2013 | 31,66 |
| 2014 | 31,89 |
| 2015 | 32,16 |
| 2016 | 32,11 |
| 2017 | 32,19 |
| 2018 | 32,41 |
| 2019 | 32,47 |
| 2020 | 32,66 |
| 2021 | 32,83 |
| 2022 | 32,96 |
| 2023 | 33,10 |
| 2024 | 33,28 |
| 2025 | 33,31 |
Population in pre-productive and post-productive age (persons)
Population in pre-productive age consists of population aged 0 to 14. The post-productive age population includes inhabitants aged 65 and more including not specified age. The indicator is given in %.
| Month | Population in pre-productive age | Population in post-productive age |
|---|---|---|
| 1996 | 18,26 | 11,70 |
| 1997 | 17,37 | 11,95 |
| 1998 | 16,50 | 12,09 |
| 1999 | 15,66 | 12,20 |
| 2000 | 14,88 | 12,30 |
| 2001 | 14,16 | 12,31 |
| 2002 | 13,49 | 12,38 |
| 2003 | 12,93 | 12,46 |
| 2004 | 12,46 | 12,55 |
| 2005 | 12,17 | 12,70 |
| 2006 | 11,96 | 12,84 |
| 2007 | 11,87 | 13,00 |
| 2008 | 11,88 | 13,18 |
| 2009 | 12,09 | 13,42 |
| 2010 | 12,36 | 13,58 |
| 2011 | 12,97 | 14,82 |
| 2012 | 13,38 | 15,21 |
| 2013 | 13,82 | 15,65 |
| 2014 | 14,31 | 16,09 |
| 2015 | 14,70 | 16,56 |
| 2016 | 15,21 | 17,14 |
| 2017 | 15,69 | 17,62 |
| 2018 | 16,13 | 18,11 |
| 2019 | 16,43 | 18,54 |
| 2020 | 16,68 | 18,94 |
| 2021 | 15,71 | 19,35 |
| 2022 | 15,70 | 19,72 |
| 2023 | 15,58 | 20,07 |
| 2024 | 15,37 | 20,34 |
| 2025 | 15,05 | 20,62 |
Children in kindergardens (persons)
Children in kindergartens make up the total number of children attending preschool facilities in the city of Bratislava in a year.
| Month | Children in kindergardens |
|---|---|
| 1996 | 14262 |
| 1997 | 13559 |
| 1998 | 13013 |
| 1999 | 12279 |
| 2000 | 11559 |
| 2001 | 10918 |
| 2002 | 10787 |
| 2003 | 10680 |
| 2004 | 10848 |
| 2005 | 10550 |
| 2006 | 10599 |
| 2007 | 10830 |
| 2008 | 11125 |
| 2009 | 11480 |
| 2010 | 11739 |
| 2011 | 12124 |
| 2012 | 12725 |
| 2013 | 13127 |
| 2014 | 13623 |
| 2015 | 14205 |
| 2016 | 14420 |
| 2017 | 14799 |
| 2018 | 15324 |
| 2019 | 15662 |
| 2020 | 15983 |
| 2021 | 16332 |
| 2022 | 17274 |
| 2023 | 17467 |
| 2024 | 17250 |
Completed dwellings
Completed dwellings are those that were passed as acceptable by an approving officer after the construction was completed. It refers to completed dwellings in constructions intended for living, i. e. in housing buildings, family houses and in polyfunctional buildings. There are included also dwellings in constructions undisposed for living for example in administrative buildings, banks, posts. Completed dwellings refer to dwellings acquired by new construction, improvements or another construction repairs in a year.
| Month | Completed dwellings |
|---|---|
| 2001 | 1362 |
| 2002 | 2048 |
| 2003 | 1284 |
| 2004 | 1987 |
| 2005 | 3211 |
| 2006 | 2521 |
| 2007 | 3992 |
| 2008 | 3013 |
| 2009 | 3741 |
| 2010 | 3242 |
| 2011 | 1768 |
| 2012 | 2916 |
| 2013 | 1569 |
| 2014 | 1686 |
| 2015 | 2394 |
| 2016 | 1952 |
| 2017 | 2794 |
| 2018 | 2771 |
| 2019 | 2838 |
| 2020 | 2793 |
| 2021 | 1910 |
| 2022 | 1964 |
| 2023 | 3375 |
| 2024 | 2067 |
The visitor in accommodation establishment of tourism (persons)
The visitor in accommodation establishment of tourism is a person using services of temporary accommodation establishment regardless of country of permanent residence. Children are also included in the number of visitors. Number of visitors is presented for the months of the each year.
| Month | The visitor in accommodation establishment of tourism |
|---|---|
| September 2017 | |
| August 2017 | |
| July 2017 | |
| June 2017 | |
| May 2017 | |
| April 2017 | |
| March 2017 | |
| February 2017 | |
| December 2017 | |
| November 2017 | |
| October 2017 | |
| January 2017 | |
| September 2018 | |
| August 2018 | |
| July 2018 | |
| June 2018 | |
| May 2018 | |
| April 2018 | |
| March 2018 | |
| February 2018 | |
| December 2018 | |
| November 2018 | |
| October 2018 | |
| January 2018 | |
| September 2019 | |
| August 2019 | |
| July 2019 | |
| June 2019 | |
| May 2019 | |
| April 2019 | |
| March 2019 | |
| February 2019 | |
| December 2019 | |
| November 2019 | |
| October 2019 | |
| January 2019 | |
| September 2020 | |
| August 2020 | |
| July 2020 | |
| June 2020 | |
| May 2020 | |
| April 2020 | |
| March 2020 | |
| February 2020 | |
| December 2020 | |
| November 2020 | |
| October 2020 | |
| January 2020 | |
| September 2021 | |
| August 2021 | |
| July 2021 | |
| June 2021 | |
| May 2021 | |
| April 2021 | |
| March 2021 | |
| February 2021 | |
| December 2021 | |
| November 2021 | |
| October 2021 | |
| January 2021 | |
| September 2022 | |
| August 2022 | |
| July 2022 | |
| June 2022 | |
| May 2022 | |
| April 2022 | |
| March 2022 | |
| February 2022 | |
| December 2022 | |
| November 2022 | |
| October 2022 | |
| January 2022 | |
| September 2023 | |
| August 2023 | |
| July 2023 | |
| June 2023 | |
| May 2023 | |
| April 2023 | |
| March 2023 | |
| February 2023 | |
| December 2023 | |
| November 2023 | |
| October 2023 | |
| January 2023 | |
| September 2024 | |
| August 2024 | |
| July 2024 | |
| June 2024 | |
| May 2024 | |
| April 2024 | |
| March 2024 | |
| February 2024 | |
| December 2024 | |
| November 2024 | |
| October 2024 | |
| January 2024 | |
| September 2025 | |
| August 2025 | |
| July 2025 | |
| June 2025 | |
| May 2025 | |
| April 2025 | |
| March 2025 | |
| February 2025 | |
| December 2025 | |
| November 2025 | |
| October 2025 | |
| January 2025 | |
| September 2026 | |
| August 2026 | |
| July 2026 | |
| June 2026 | |
| May 2026 | |
| April 2026 | |
| March 2026 | |
| February 2026 | |
| December 2026 | |
| November 2026 | |
| October 2026 | |
| January 2026 |